Weekly median apartment prices in vienna
This project has been set up to show the weekly median apartment prices of Vienna.
Have a look at the result: Apartment Dashboard.
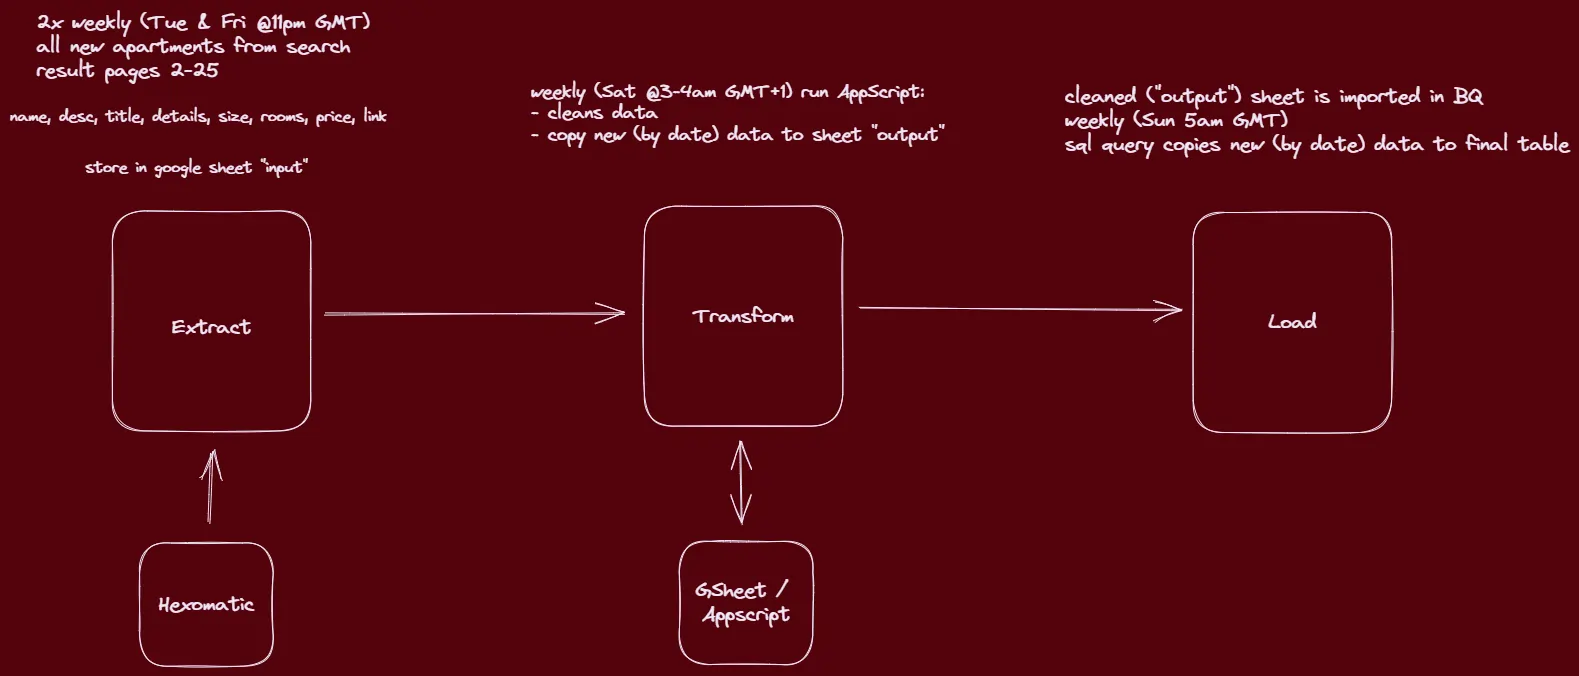
To acomplish this project, a crawler is used twice a week to search for listings of apartments and houses. This crawler is powered by Hexomatic and extracts information from the first 25 listing (search result) pages, writing it into a Google Spreadsheet.
Every Saturday, an application script runs to clean and sanitize the data in the input sheet, before writing it into the output sheet. This data is then loaded every Sunday into a BigQuery table using scheduled queries.
From a GCP API Gateway a cloud function is called which queries a view which calculates the weekly median.
Astro is used as the frontend framework. The data is loaded directly from the API Gateway into a svelte component, using lightweight charts to create the graph of the median apartment prices.
In the future, more views and reports will be added to the dashboard, as well as detailed reporting on the data extracted by the crawler.
